
Applications
The following list provides some typical results of low-frequency ultrasonic investigations.
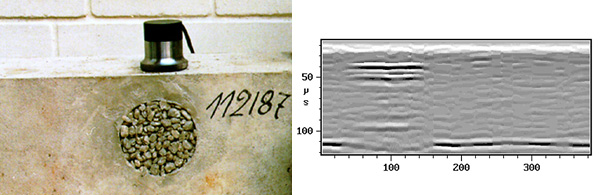
Fig. 1: Investigation of a concrete specimen with a thickness of 20 cm and a crack area: measurement setup on the left and B-scan (cross-sectional scan) on the right.
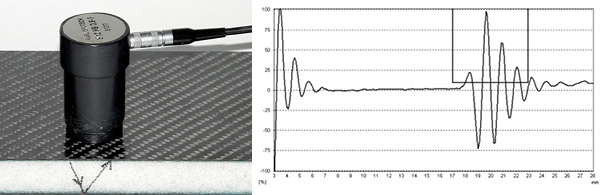
Fig. 2: Inspection of a sandwich component with foam core: Measurement setup on the left and A-scan on the right.
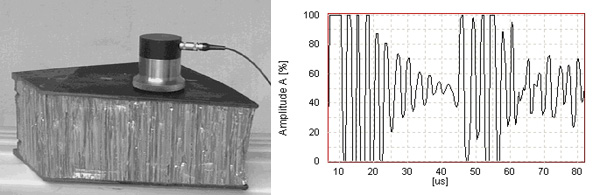
Fig. 3: Inspection of a sandwich component with aluminium core: Measurement setup on the left and A-scan on the right.